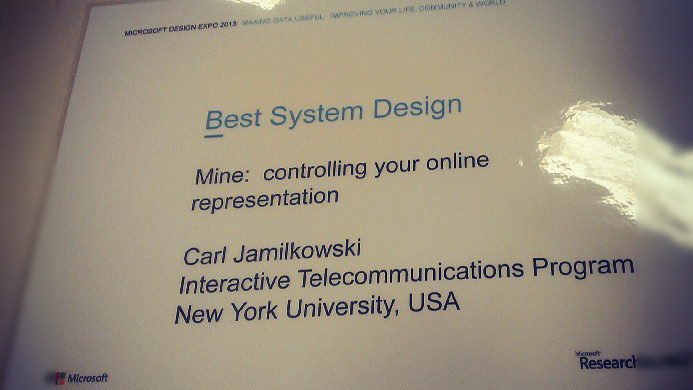
Award: Best System Design at the Microsoft Design Expo
Team Mine from NYU ITP wins Best System Design at the 2013 Microsoft Research Faculty Summit as part of the Design Expo […]
Design Expo was a class at NYU ITP taught by Clay Shirky. The class was a participant of the 2013 Microsoft Research “Design Expo – Making Data Useful: Improving Your Life, Community, and World”.
Team Mine from NYU ITP wins Best System Design at the 2013 Microsoft Research Faculty Summit as part of the Design Expo […]
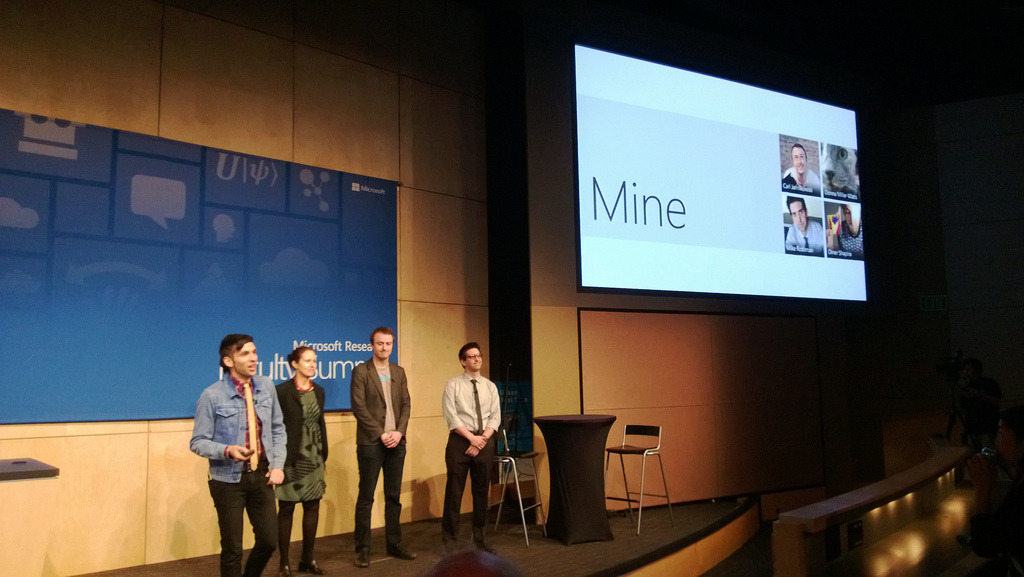
My team brought the project to the 2013 Microsoft Research Faculty Summit as part of “Design Expo – Making Data
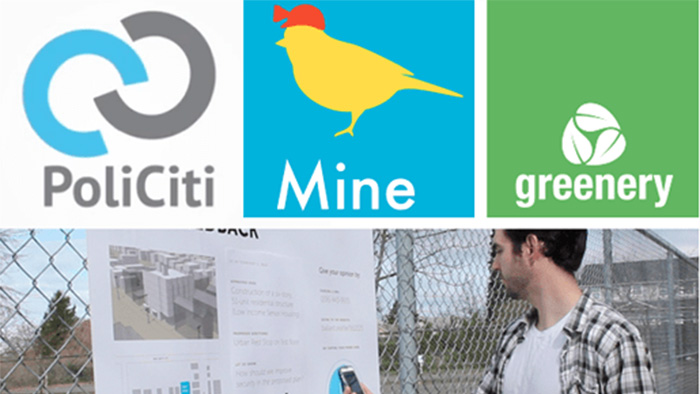
This was the logo I made for the Mine project. The project is all about data miners, giving users a
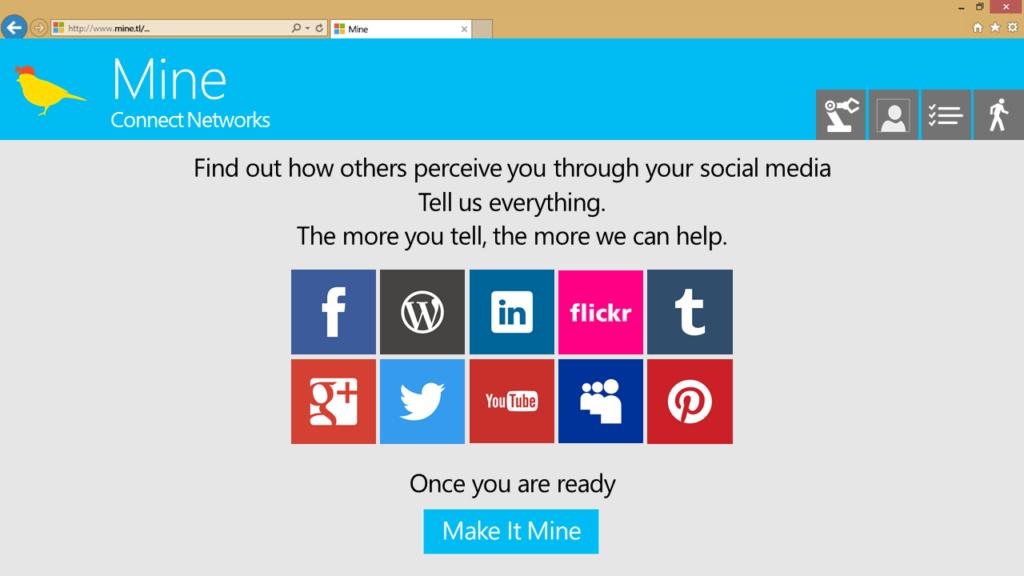
I redesigned the UI for the presentation at MS Research, giving it a more cohesive look. My use of the Metro design
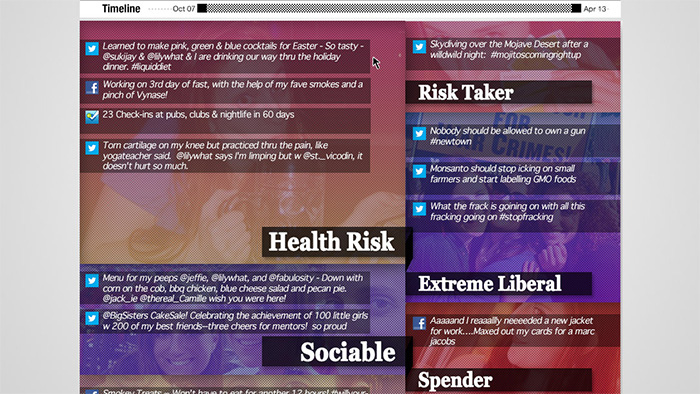
After gathering some great data from our interviews, we iterated to the final presentation of our design.

The name ‘Mine’ came to be while envisioning the power of using this product. We simplified our interfaces for impact and clarity while also capturing some playful interactions.
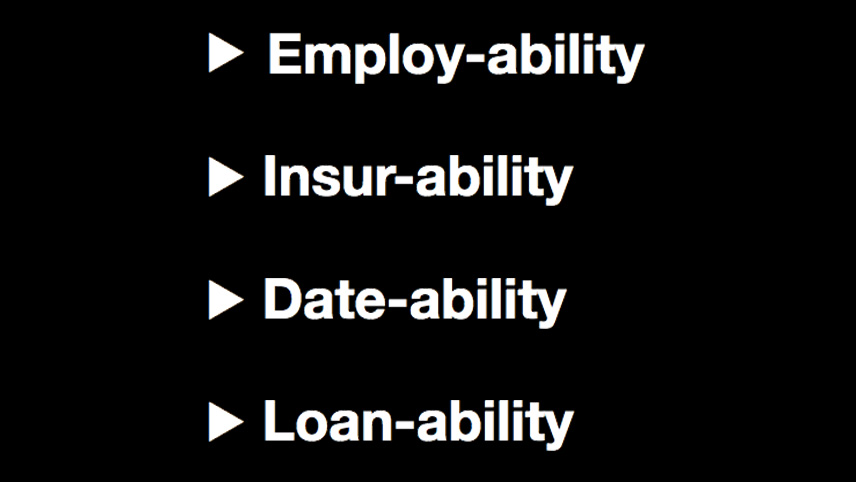
We focused on statistics, text analysis, and displaying results through easily digestible tidbits of data insight.
Bringing together everything we brainstormed and discussed, we created an early design iteration of what would eventually become Mine.
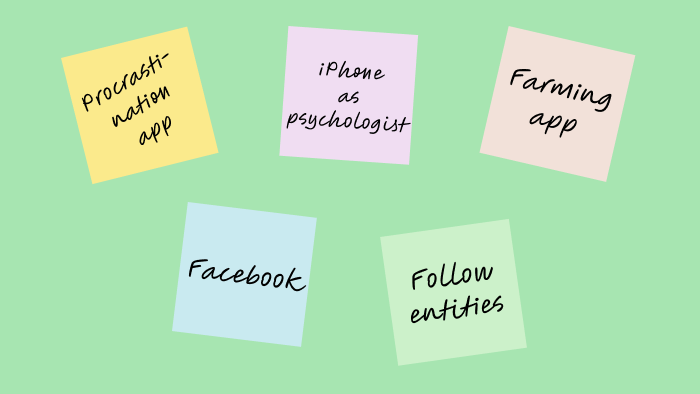
What can we create that uses data to improve the lives of individuals? We started by generating some ideas, then came at it from a couple other directions around the data itself.